
Performance Matrix
The Performance Matrix module provides an in-depth analysis of EPC vendors’ performance, covering timeliness, quality compliance, satisfaction levels, fund utilization, and project completion ratios. It is designed to help administrators evaluate and rank vendors effectively.
1. Accessing Performance Matrix
- From the left-hand navigation menu, click on Performance Matrix.
- The screen displays the Vendor Leaderboard, along with performance indicators.
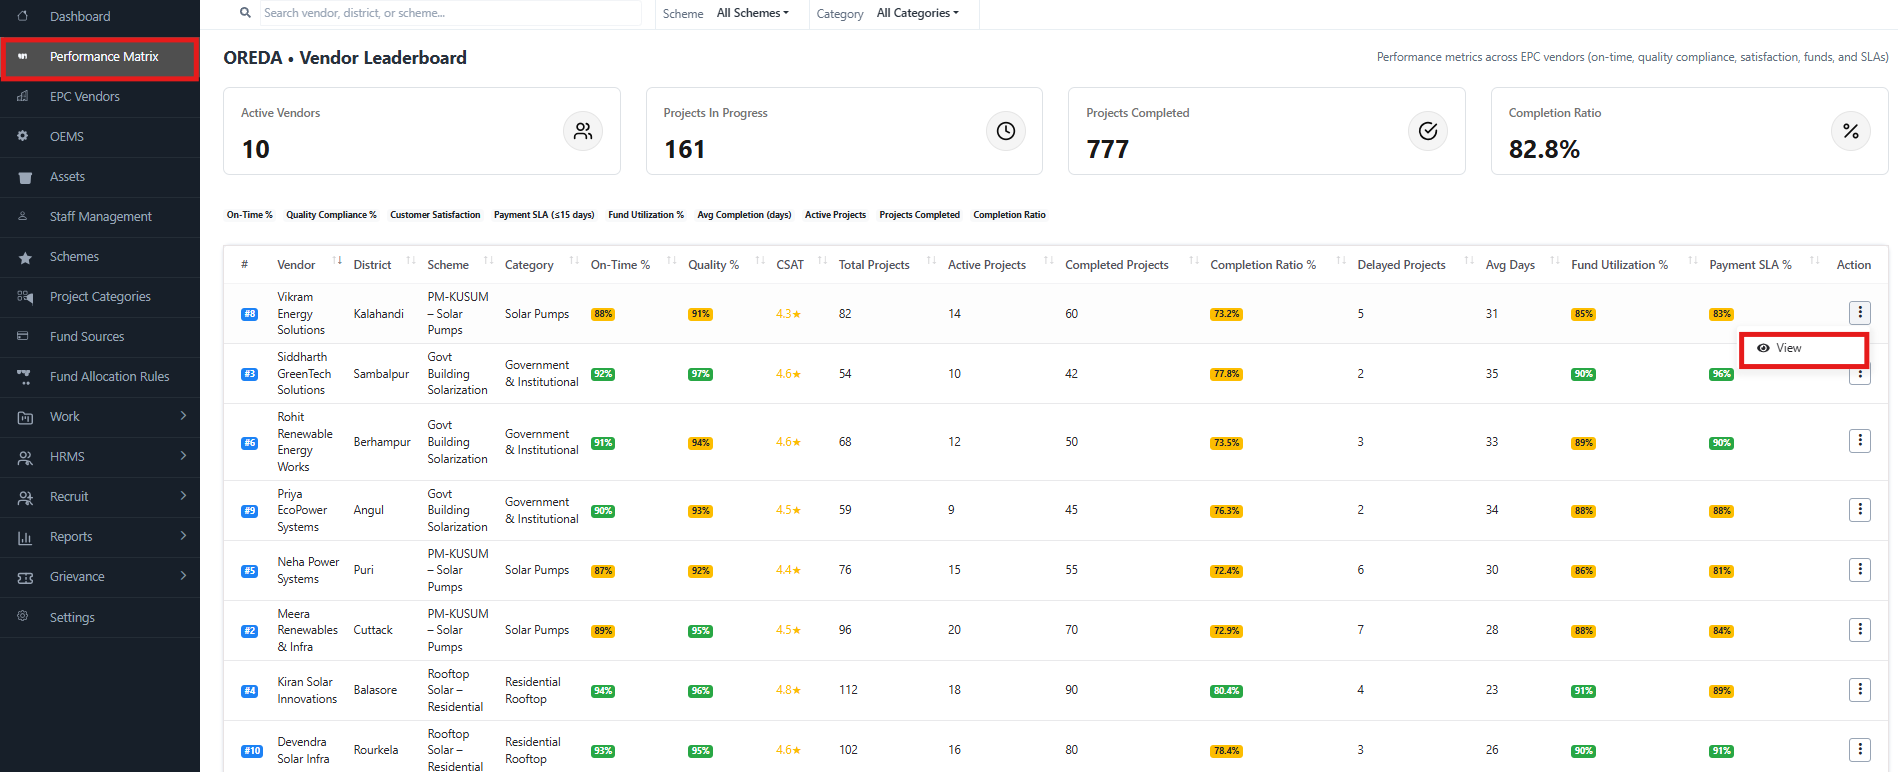
2. Key Metrics Overview (Top Panel)
At the top of the module, summary indicators are shown:
- Active Vendors – The total number of EPC vendors currently working.
- Projects In Progress – Ongoing projects under execution.
- Projects Completed – Total number of successfully completed projects.
- Completion Ratio (%) – Percentage of projects completed against assigned projects.
3. Vendor Leaderboard (Detailed Table)
The leaderboard ranks EPC vendors based on performance metrics.
Columns in the Leaderboard:
- # (Rank) – Vendor’s rank based on performance.
- Vendor – Name of the EPC vendor.
- District – Location/district of the vendor’s projects.
- Scheme – Scheme under which the vendor is executing projects (e.g., PM-KUSUM, Govt Building Solarization, Residential Rooftop).
- Category – Project category (e.g., Solar Pumps, Government & Institutional, Residential Rooftop).
- On-Time % – Percentage of projects completed within the scheduled timeline.
- Quality % – Quality compliance percentage.
- CSAT – Customer Satisfaction Score, represented in star ratings.
- Total Projects – Number of total projects handled by the vendor.
- Active Projects – Ongoing projects.
- Completed Projects – Number of finished projects.
- Completion Ratio % – Completed projects divided by total projects.
- Delayed Projects – Projects delayed beyond the scheduled timeline.
- Avg Days – Average number of days taken for completion.
- Fund Utilization % – Percentage of allocated funds utilized by the vendor.
- Payment SLA % – Adherence to payment Service Level Agreement timelines.
4. Actions
Each vendor row has an Action menu (⋮).
- View – Opens detailed vendor performance reports, project data, and fund utilization.
5. Example Insights
From the screenshot:
- Kiran Solar Innovations (#4):
- On-Time %: 94%
- Quality %: 96%
- CSAT: 4.8★
- Completion Ratio: 80.4% (highest in list)
- Vikram Energy Solutions (#8):
- On-Time %: 88%
- Quality %: 91%
- CSAT: 4.3★
- Avg Days: 31
This allows Admins to benchmark vendor performance and take corrective actions.
6. Filters & Search Options
At the top, Admins can refine results using filters:
- Scheme filter – View vendors by specific schemes.
- Category filter – Narrow down by project categories.
- Search bar – Search vendors, districts, or schemes directly.